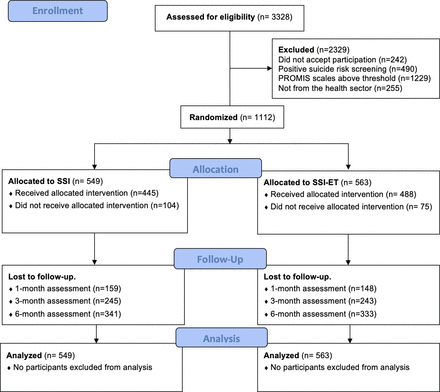
Of the 3328 individuals who sought to participate in this project from 19 May 2020 to 31 December 2021, 3086 consented to participate in the study, and 490 were excluded and referred to a psychiatrist due to concerns about suicide risk. We enrolled 1112 participants who met the inclusion criteria and subsequently allocated them to SSI (n=549) or SSI-ET (n=563) (figure 1). The majority of the sample consisted of women (86.4%), and the mean age of the sample was 37.2 (SD=9.46). Regarding symptom severity at baseline, a high heterogeneity was observed in participants’ symptom levels, with distinct distributions across different symptom domains. While most individuals exhibited moderate symptom levels across all domains, this predominance was substantially higher for anxiety symptoms (84.1%) compared with depression (39.8%) and irritability (42.0%). Each group is further described in table 1.
Primary outcome
The estimated cumulative proportion of incident severe cases at 1 month was 6.9% (95% CI 9.4% to 4.4%) in the SSI group and 4.8% (95% CI 6.9% to 2.7%) in the SSI-ET group, at 3 months it was 12.4% (95% CI 15.8% to 8.9%) in the SSI group and 9.9% (95% CI 12.9% to 6.8%) in the SSI-ET group, and at 6 months it was 17.5% (95% CI 13.1% to 21.6%) in the SSI group and 15% (95% CI 10.9% to 18.8%) in the SSI-ET group with no difference between groups (HR=0.81, 95% CI 0.83 to 1.79, p=0.291) (figure 2).
Survival analysis. SSI, single-session intervention; SSI-ET, SSI with enhanced psychoeducation.
Secondary outcomes
Incidence of subthreshold levels of emotional distress (T-scores above 60). This analysis was performed using the sample that did not have a score of 60 or above at baseline (n=143). The estimated cumulative proportion of incident severe cases at 1 month was 20.8% (95% CI 31.5% to 8.5%) in the SSI group and 19.4% (95% CI 17% to 21.2%) in the SSI-ET group, at 3 months it was 25.2% (95% CI 36.6% to 11.8%) in the SSI group and 25.7% (95% CI 37.3% to 11.9%) in the SSI-ET group, and at 6 months it was 32.7% (95% CI 45.1% to 17.5) in the SSI group and 28.9% (95% CI 41.3% to 13.9%) in the SSI-ET group, with no difference between groups (HR=0.81, 95% CI 0.58 to 2.53, p=0.587).
Relevant time effects. Linear mixed models, using all available data, showed prominent time effects for all outcomes, indicating significant differences from baseline to the 1, 3 and 6 month follow-up assessments (online supplemental table S2). The mean changes were significant in each treatment arm. Standardised symptom reduction for anxiety symptoms from baseline to 1 month was Cohen’s d=0.68 (p<0.001) for SSI and Cohen’s d=0.77 (p<0.001) for SSI-ET. Standardised symptom reduction for depressive symptoms from baseline to 1 month was Cohen’s d=0.86 (p<0.001) for SSI and Cohen’s d=1.06 (p<0.001) for SSI-ET. Finally, standardised symptom reduction for irritability symptoms from baseline to 1 month was Cohen’s d=0.68 (p<0.001) for SSI and Cohen’s d=0.89 (p<0.001) for SSI-ET. All differences were maintained at the 3 and 6 month follow-ups with similar magnitudes (figure 3).
Estimated scores on all secondary outcomes as a function of each timepoint (baseline, 1 month, 3 months and 6 months follow-up). PROMIS, Patient-Reported Outcomes Measurement Information System; SSI, single-session intervention; SSI-ET, SSI with enhanced psychoeducation.
Time-by-group interactions. We found significant time-by-group interaction for the PROMIS anxiety scores (online supplemental table S2), meaning that at 1 month SSI was significantly worse than SSI-ET in reducing PROMIS anxiety scores (mean difference=1.12, 95% CI 0.14 to 2.11, p=0.024; Cohen’s d=0.14). The difference was no longer significant at the 3 month or 6 month follow-ups (Cohen’s d range 0.05–0.09, p values >0.05). No time-by-group interactions were observed for irritability or depressive symptoms.
NPS and overall satisfaction. There were no significant differences in the probability of participants recommending the treatments. The estimated NPS for SSI was 53% and that for SSI-ET was 54.6% (mean difference=2.6%, t=0.339, df=27, p value=0.737). There were also no differences between the overall treatment satisfaction with scores of 5.6 for SSI and 5.7 for SSI-ET (mean difference=0.12, t=1.125, df=103, p-value=0.213).
Therapists’ fidelity. The supervisor observed 10 psychoeducation sessions without videos and 9 sessions with videos. The average fidelity score for therapists of SSI was 4.94 (SD 0.1), while for therapists facilitating the SSI-ET the mean score was 4.78 (SD 0.32), with no difference between groups (p>0.05).
Attrition. The flow diagram in figure 1 illustrates the number of individuals assessed at 1, 3, and 6 month follow-up, demonstrating considerable attrition rates. There was a significant between-group difference in the proportion of participants who did not receive the allocation intervention (18.9% in SSI vs 13.3% in SSI-ET, χ2=6.16, df=1, p value=0.013). A sensitivity analysis using modified ITT (excluding those who did not receive allocated intervention) revealed similar results for all outcomes (primary outcome: HR=0.807, p=0.269). There were no significant differences between losses during follow-up (χ2=0.958, df=3, p value=0.8114).
Post-hoc equivalence test. Equivalence test between treatment arms was within the equivalence bounds of −7% and 7% for the primary outcome: SSI vs SSI-ET (Z=−1.81, p=0.035).
Safety assessment. Three patients attempted suicide during the 1 month follow-up (SSI: 2/349, 0.6% vs SSI-ET: 1/367, 0.3%, χ2=0.39, p=0.534), one during the 3 months follow-up (SSI: 1/288, 0.3% vs SSI-ET: 0/292, 0%, χ2=1.02, p=0.314) and three at 6 months follow-up (SSI: 1/235, 0.4% vs SSI-ET: 2/250, 0.8%, χ2=0.28, p=0.599). Nine patients were hospitalised due to mental health reasons during the 1 month follow-up (SSI: 4/349, 1.1% vs SSI-ET: 5/367, 1.4%, χ2=0.07, p=0.795), seven at the 3 months follow-up (SSI: 2/288, 0.7% vs SSI-ET: 5/292, 1.7%, χ2=1.26, p=0.262) and four at 6 months follow-up (SSI: 1/235, 0.4% vs SSI-ET: 3/250, 1.2%, χ2=0.89, p=0.346). No differences were observed between the SSI and SSI-ET groups in terms of undesirable side effects related to the intervention (online supplemental table S3).


