As extreme weather becomes increasingly frequent and severe, its disproportionate impact on low- and moderate-income (LMI) communities grows. The recent regional devastation of Hurricanes Helene and Milton reemphasized this reality.
The community development teams at the Federal Reserve Banks of New York, Philadelphia, and Cleveland each conducted studies shedding light on these communities’ vulnerabilities and their flood-risk exposure. The studies delve into the economic, social, and environmental consequences of flooding. They aim to inform policymakers and community leaders on resiliency measures most needed in the face of growing climate risk.
New York City’s LMI renters particularly vulnerable in and after floods
Hurricane Ida, which struck New York in early September 2021, exposed the region’s vulnerability to extreme rainfall and inland flooding. Eleven people died in their basement homes as a result of Ida, highlighting the specific risk to inhabitants of low-lying units.
“September 2021 [Hurricane Ida] is when things changed. Water took over the sewer system and backed into my home. I didn’t realize how vulnerable my [basement apartment] was until then. I spent hours with buckets trying to get the water out and cleaning up after that. Even today, any time water comes down, water gets in.”
– James
LMI renters face elevated risk from flooding in New York City. In addition to housing affordability challenges, residents face especially difficult challenges recovering from extreme weather events. Standard renters’ insurance does not cover flood damage. In the event of a federal disaster declaration, federal relief programs offer renters only basic coverage.
The New York Fed conducted a study to understand flooding impacts on the city’s most vulnerable renters and rental housing stock. The analysis drew on data about flood risk from First Street Foundation, a private firm that quantifies flood risk, and FEMA as well as focus groups of flood-vulnerable populations in Brooklyn. The research team initially identified the communities most vulnerable to flood losses, assessing where flood risk, LMI renter populations, and basement housing intersect.
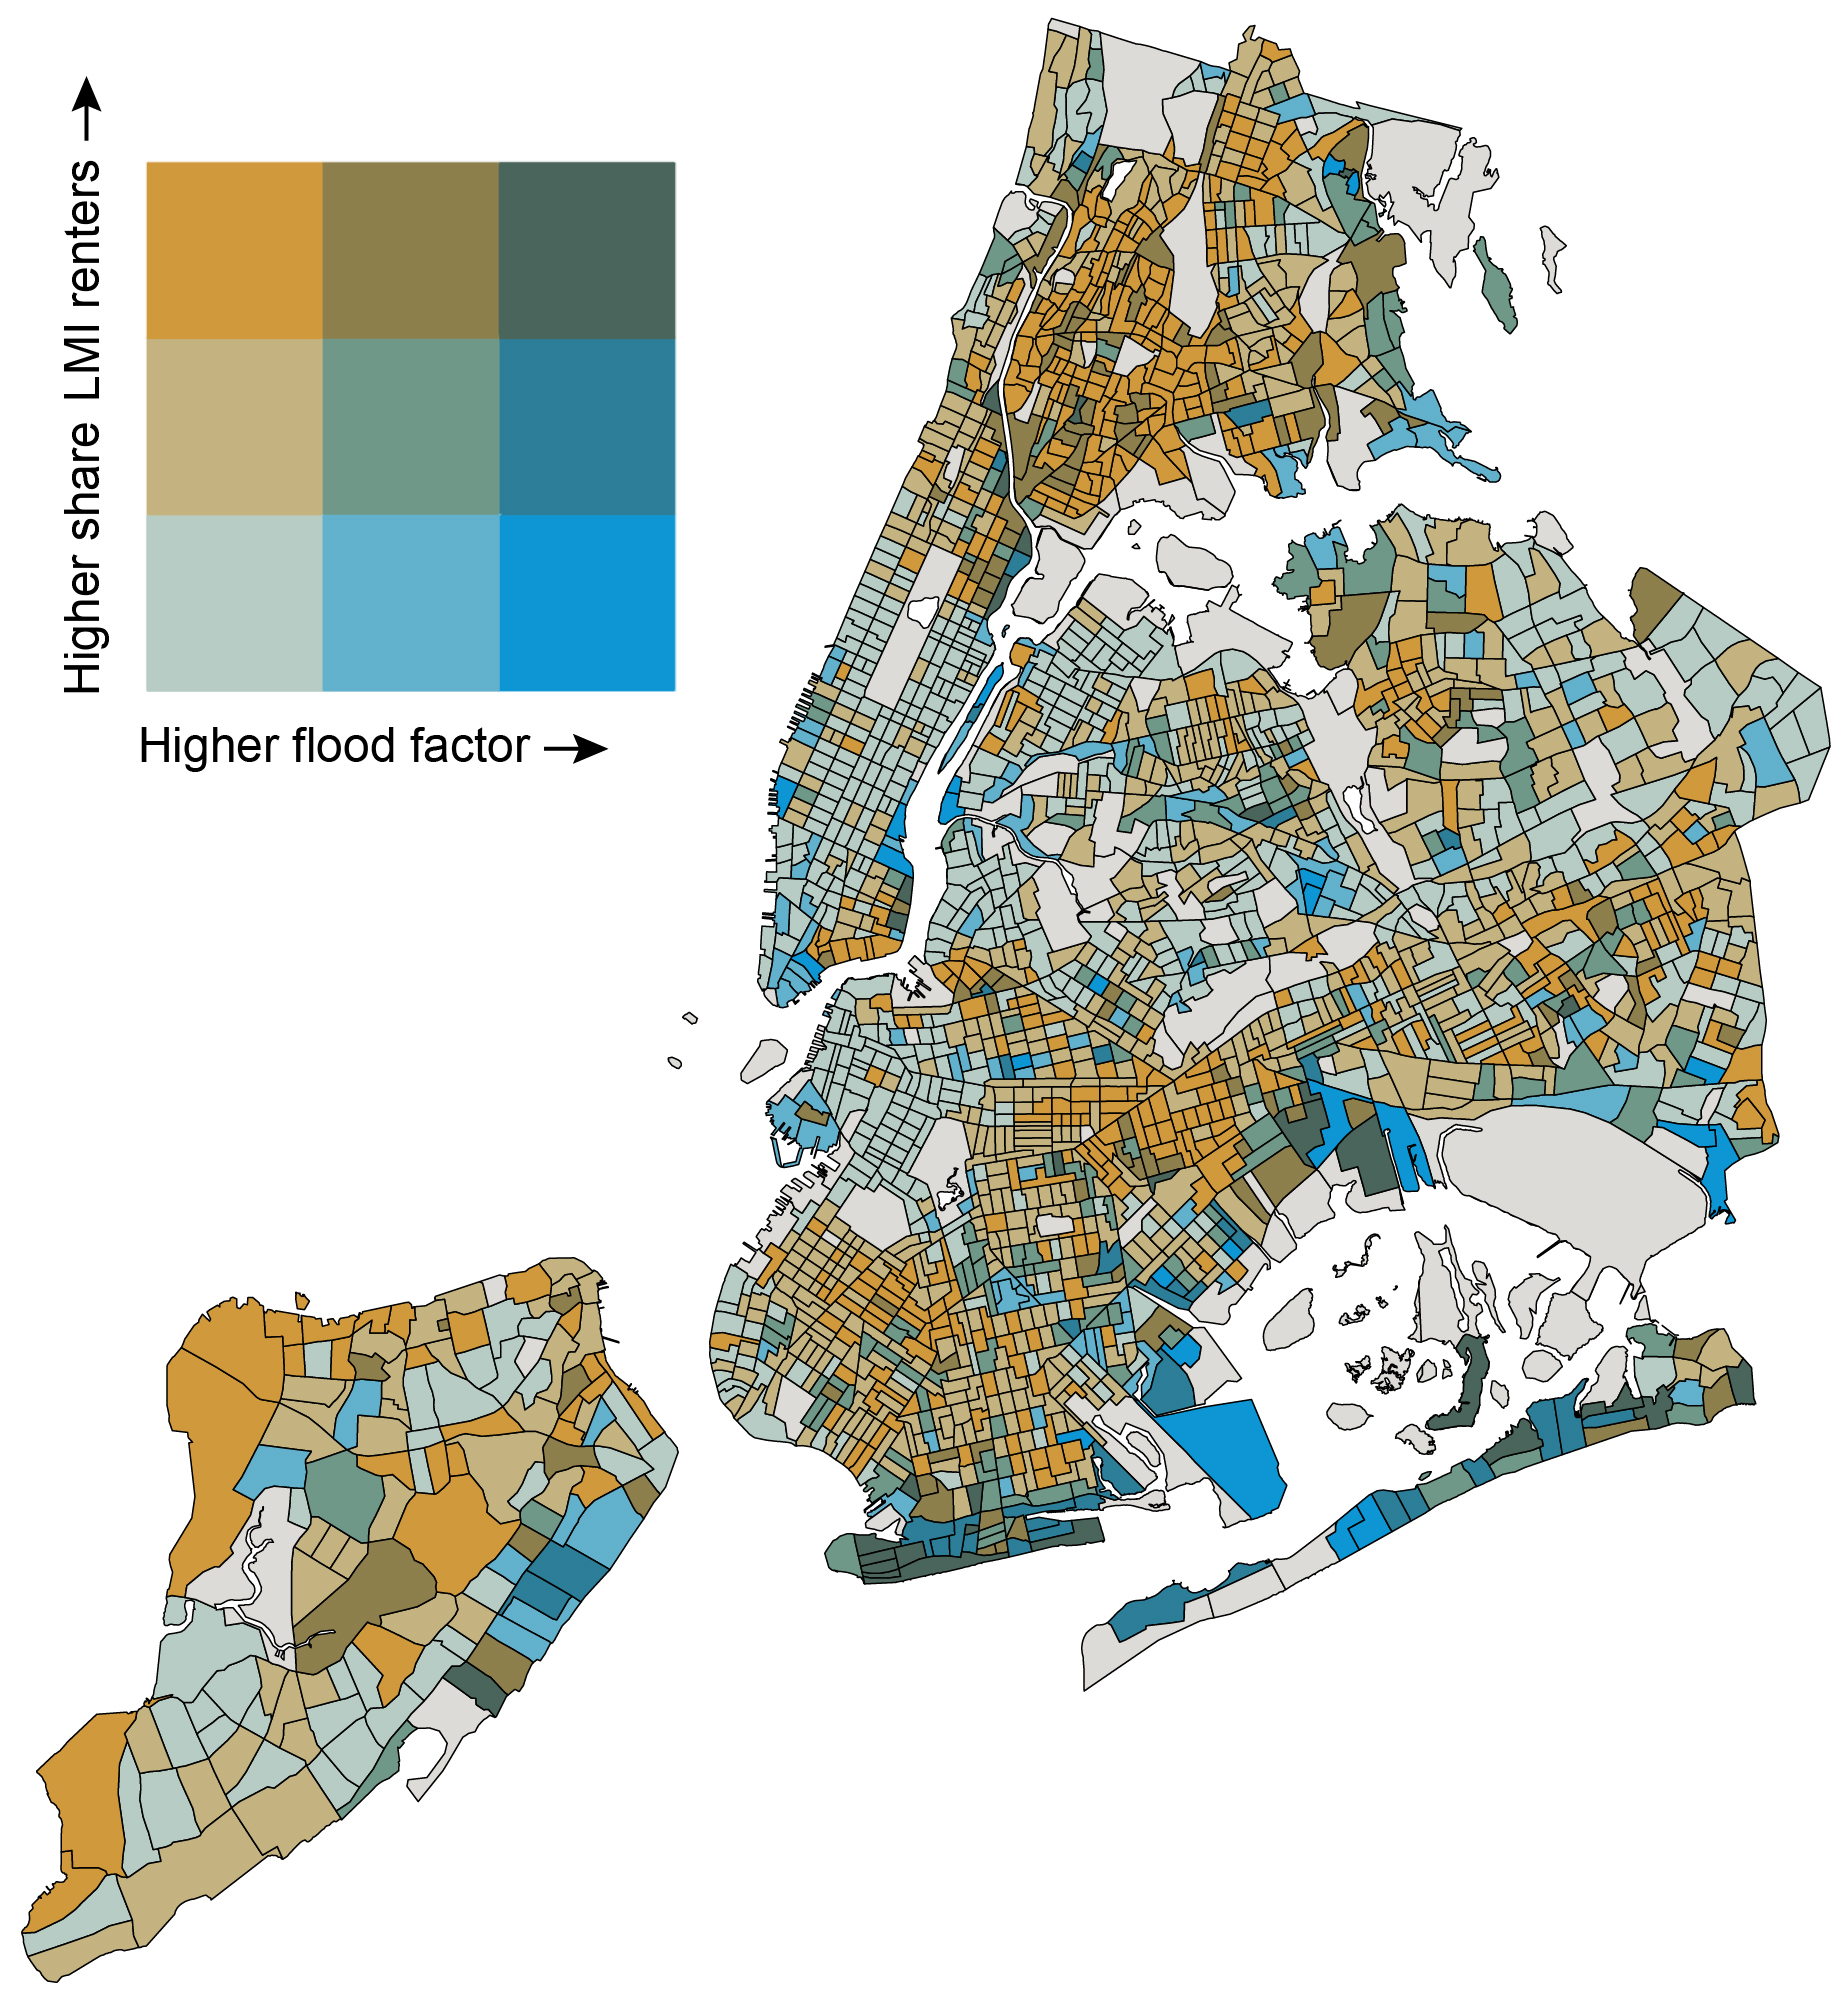
Flood Risk and Low- and Moderate-Income Renters in NYC

Note: Dark gray census tracts indicate data are not available. The numeric buckets for the share of LMI renters axis are 0-31 percent, 31-64 percent, and 64-100 percent
Coastal census tracts tend to be at highest risk, but there are several in Brooklyn, Queens, and the Bronx located more inland where LMI renters are exposed to a moderate to high flooding risk. This is notable, as rainfall-induced flooding is not captured in the flood information used to qualify households for disaster assistance and insurance.
“Some people get the cheapest insurance… I’ve seen worst-case scenarios so many times, seeing people denied [by insurance]. When things hit the fan, you want protection. Everyone should have that protection.”
– Mia
Additionally, the study found that approximately one in 10 immigrants, LMI residents, and residents of color live in a census tract that includes flood-prone basement housing. The city’s most vulnerable residents often reside in these units, which tend to be informal and therefore most accessible to those seeking less expensive rents.
| Basement Type | LMI | Immigrants | Racial/ethnic minorities | Monthly Median Rent ($) |
|---|---|---|---|---|
| Census Tracts with Flood-Prone Basements | 9% | 9% | 10% | $1494.36 |
Note: The first three data columns reflect the percentage of the total population in tracts with moderate to high flood risk (Flood Factor of 3 or above and/or > 10 percent of properties in a Special Flood Hazard Area. The final column shows the mean of median rents across census tracts.
New York Fed researchers then conducted focus groups in partnership with organizations from Brooklyn and Queens to understand the impacts of flood events on the household finances of LMI residents. The focus groups produced four main insights:
- Diminished housing safety and stability were the most consequential impacts of flood events. Basement apartment residents experienced some of the worst recurring impacts.
- Damage and loss of possessions, as well as worsened mental and physical health, are key consequences of flooding.
- Residents heavily depended on community networks for aid and assistance.
- Economic barriers like housing affordability prevent some residents from moving to higher ground.
“In Bed-Stuy, we have a lot of community groups and churches… that’s where the support was. It was the community. None of that was mobilized through the city. We needed to check on single moms in this building, we needed to check on seniors in that building, all while making sure that you’re okay too.”
– Ava
Communities at high coastal and inland flooding risk in Mid-Atlantic states
The Philadelphia Fed authored two reports on flood hazards in Pennsylvania, New Jersey, and Delaware.
One report examined flood exposure and risk by neighborhood income level using flood measures from the First Street Foundation. The objective was to understand flood implications for lower-income communities across the three states.
Findings from the analysis on neighborhood income disparities and flood hazards:
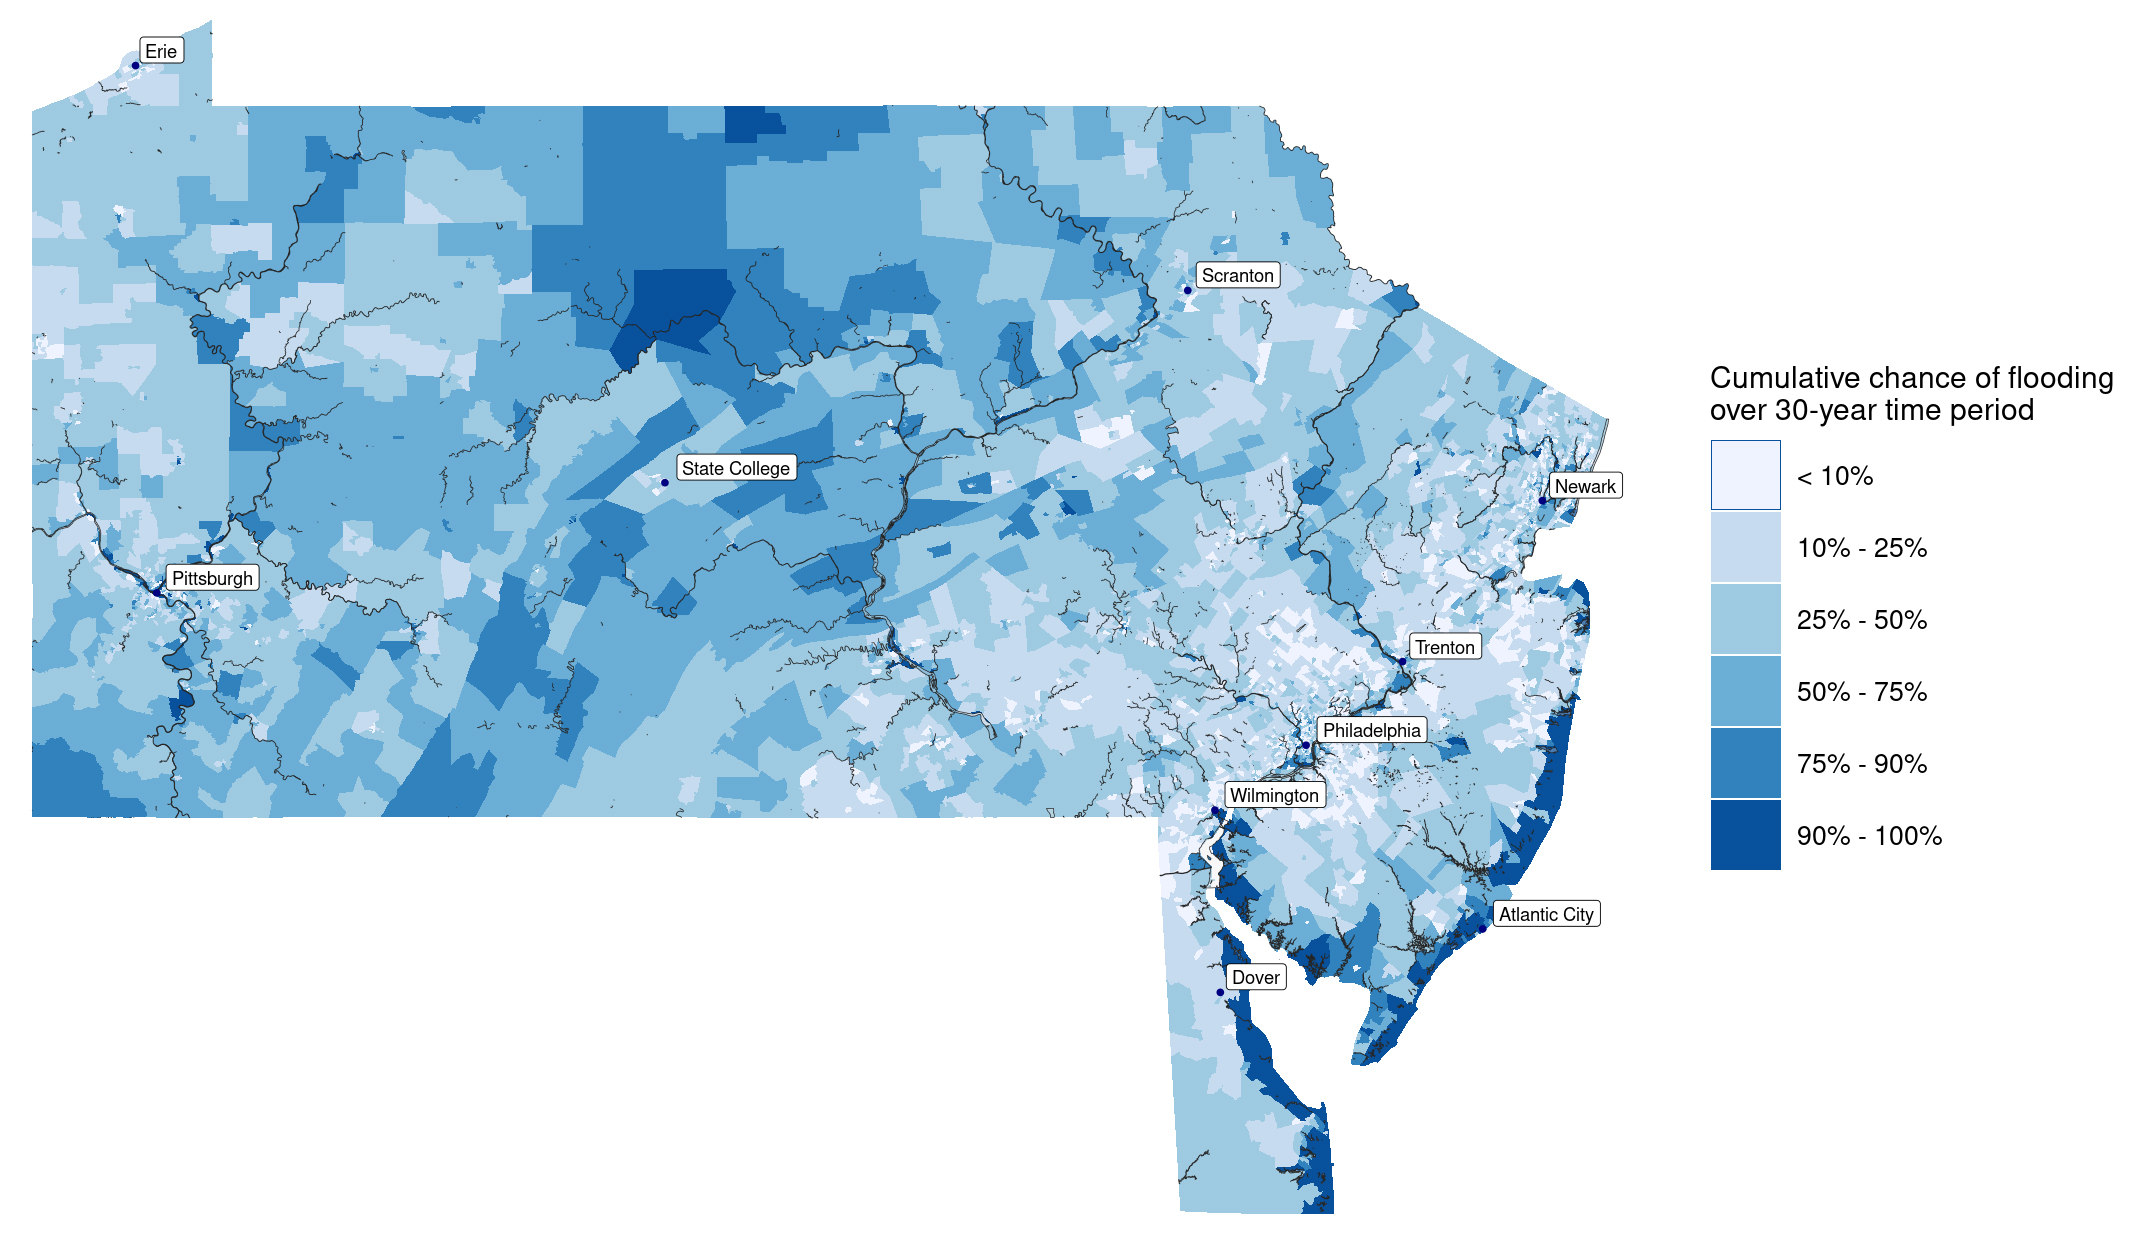
- While properties along the Atlantic Coast in New Jersey and Delaware face the greatest flood hazards, inland properties also confront substantial danger. This is particularly the case in Pennsylvania’s river valleys.
- Although properties in higher-income neighborhoods on the coast have elevated flood exposure and risk, flooding still poses a threat to lower-income households in these high-risk areas along the shore.
- In noncoastal areas, the opposite is true—lower-income areas face greater threats than their higher-income counterparts. Lower-income neighborhoods have a higher cumulative chance of flooding over a 30-year period (40.6 percent compared with 35.4 percent), a higher average annual expected loss per property ($1,037 compared with $780), and a greater share of high-risk properties (7.6 percent versus 6.8 percent).
The disparities matter in part because flood risk in noncoastal areas of the three states is less likely to be covered by flood insurance. The second report contrasted two measures of flood risk—Federal Emergency Management Agency (FEMA) Special Flood Hazard Areas (SFHAs) and a comparable First Street Foundation measure—to understand where these measures align and diverge in identifying properties that bear substantial flood risk.
Geographic Pattern of Current Cumulative Chance of Flooding Across Third District States Over a 30-Year Period

Results from the report show that 8.8 percent of properties in noncoastal, lower-income areas do not fall within a FEMA SFHA. Yet the First Street Foundation estimates that these properties have at least a one percent annual chance of flooding.
Because insurance isn’t required for properties outside of SFHAs, households in these noncoastal areas are less likely to have flood insurance. As a result, property owners and mortgage lenders—private firms and government-sponsored entities such as Fannie Mae and Freddie Mac—may be unaware of the true risk they bear from extreme weather. Limited access to resources and insurance may leave lower-income households particularly vulnerable.
The charts below break down the shares of FEMA and First Street Foundation-designated properties in coastal and noncoastal areas by neighborhood income and majority race/ethnicity.
Shares of Properties at Risk of Flooding Based on FEMA SFHA’s and the First Street Foundation’s Measure by Neighborhood Income Status and Majority Race/Ethnicity in Mid-Atlantic States


Source: Authors’ calculation based on climate data via First Street Foundation (FSF) and the 2022 Federal Financial Institutions Examination Council (FFIEC) Census Flat File.
Resilience and recovery after the July 2022 Eastern Kentucky Flood
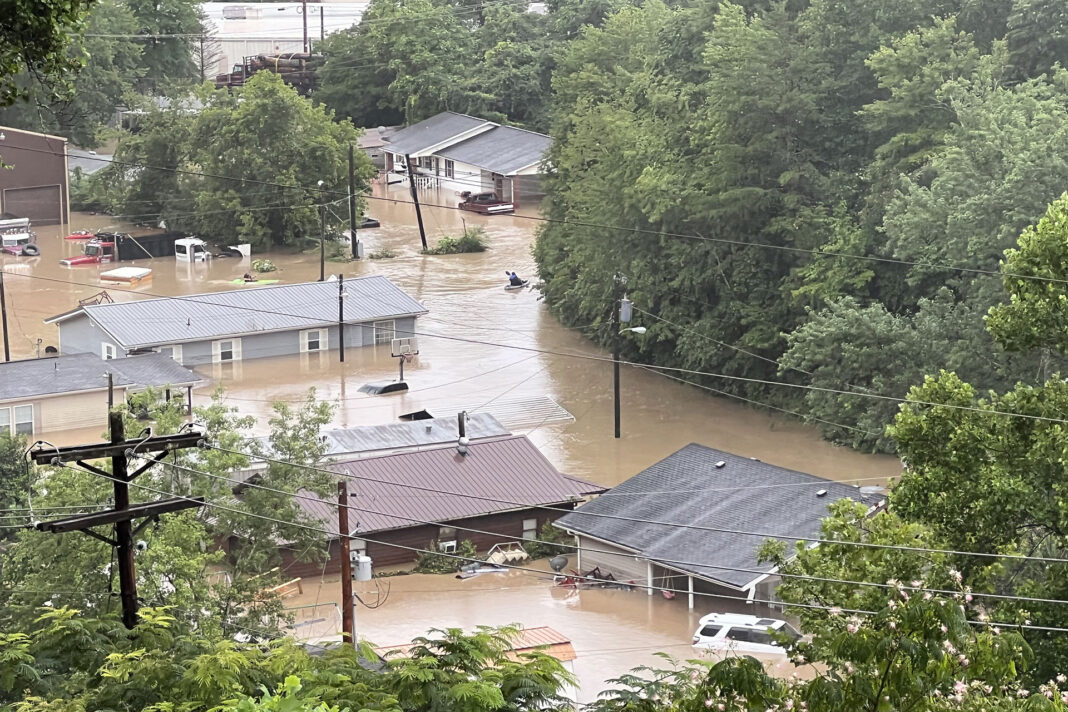
Eastern Kentucky has a long history of flooding, owing to its topography, location, and coal mining legacy. Following a particularly devastating flood in July 2022 that claimed 44 lives, the Cleveland Fed took a closer look at the disaster’s impact on housing in the 13 counties declared federal disaster areas.
Kentucky Counties Declared Federal Disaster Areas following the July 2022 Flood
Analysis of academic literature, available data, and interviews with key stakeholders directly involved in the recovery found four key takeaways:
- Flood insurance can be prohibitively costly. Flood insurance policies can be expensive, particularly for low-income households. Only five percent of homes damaged in the 2022 disaster had flood insurance. Households earning $30,000 or less per year accounted for 60 percent of damaged homes.
- Floods worsen affordable housing shortages. The flood affected nearly 9,000 housing units. Research finds that low-income households and renters are more likely to become permanently displaced because they have fewer relocation options. Additionally, damaged lower-quality housing is more likely to be demolished than rebuilt. (Source)
- Floods increase population outmigration, which, in turn, affects the local labor force. In the four hardest-hit counties, residential vacancies increased 19 percent from the third quarter through the fourth quarter of 2022. This population loss came on top of an average annual decline of 600 people going back to 1984. Fewer residents means fewer people available to fill jobs.
- The pre-existing weakness of local labor markets likely will affect the housing recovery, particularly due to a lack of available workforce in skilled trades. In the region, the construction sector, key to the housing recovery, fell 24 percent from its 2001 peak to 2022. Only employment levels in coal mining and financial activities declined more. This shortage of skilled trades workers, such as carpenters, electricians, and plumbers, has led to a backlog of people waiting to repair or replace homes.
Understanding risks to help inform recovery
These studies underscore the acute consequences of flooding for LMI communities across three distinct geographies. Focus groups with LMI renters in New York City revealed that those impacted by flooding events grappled with diminished housing safety and security and damaged or lost possessions. Additionally, these renters faced increased physical and mental health challenges, and often couldn’t move to higher ground where flood risks were lower due to economic barriers like housing affordability.
In noncoastal areas of mid-Atlantic states, flood exposure and risk tend to be higher in lower-income neighborhoods than higher-income ones. Still, the highest overall exposure and risk is concentrated on the coast. For LMI households, flooding can be particularly costly without access to the financial resources and insurance needed to recover.
Finally, as shown by the impacts of the 2022 Eastern Kentucky Flood, extreme weather not only affects individual households but has regional economic impacts as well. Affordable housing shortages, increased population outmigration, and declining employment in occupations key to recovery continued to affect the region months after the flood.
Through these studies, the Federal Reserve Banks of New York, Cleveland, and Philadelphia seek to shed light on the disproportionate impacts of flooding in lower-income communities and the economic challenges lower-income households face when recovering from such events. Findings from the research might help inform policymakers and community leaders developing targeted disaster resilience and mitigation strategies to support those most vulnerable.


